Write Up for Malware Analysis CTF created by @Bowflexin91 & @HBRH_314
Register here: https://t.co/NT6T6u1x93
Gon’ Duck Huntin’
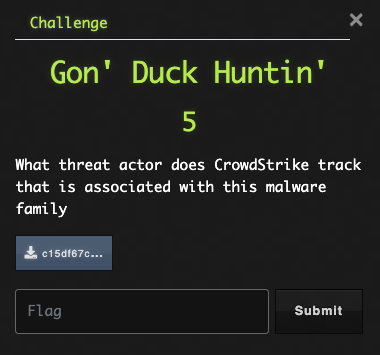
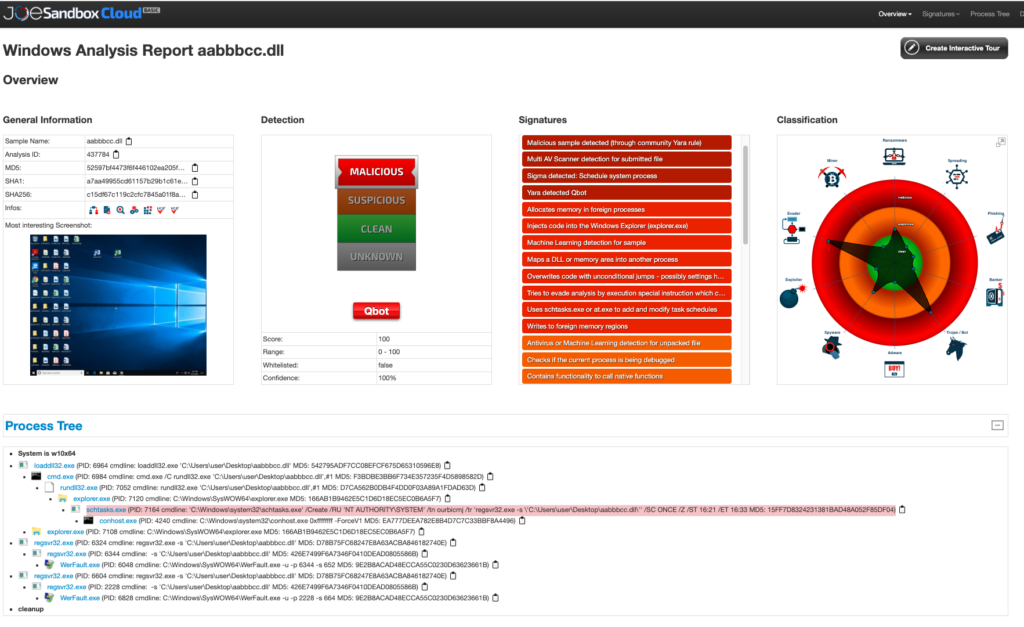
Ok, so we are looking for attribution on this sample. Let’s get the hash and do a little digging on VT to determine what we are dealing with here.
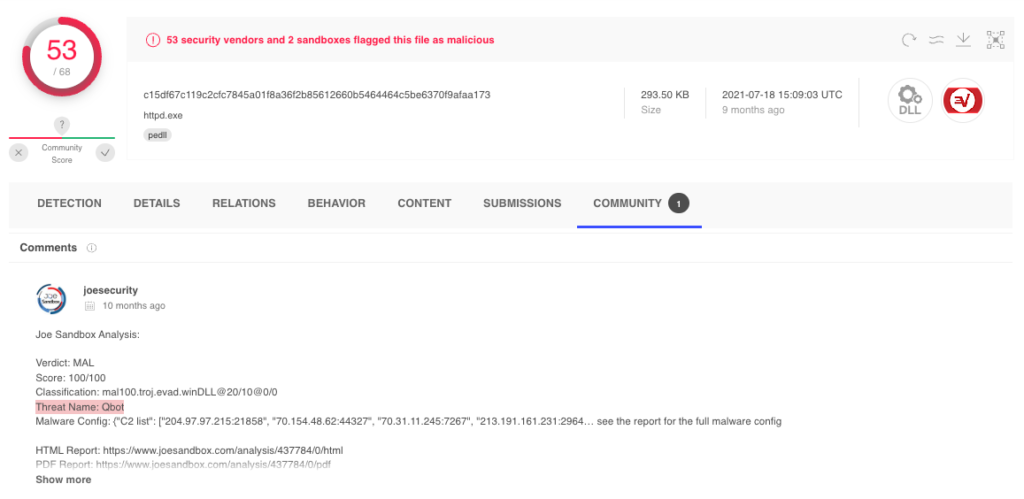
This guy Joe really seems to know his stuff. It looks like we have a Qbot sample. Let’s use our Google-Fu skills and find out what TA Crowdstrike attributes this malware to.
Flag: Mallard Spider
Matryoshka
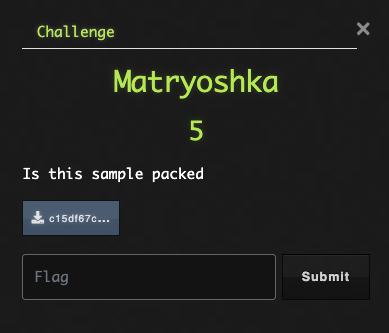
So, I guess first things first; what is a packed binary? To the Googles!
I found this:Malware writers often use packing or obfuscation to make their files more difficult to detect or analyze. Obfuscated programs are ones whose execution the malware author has attempted to hide. Packed programs are a subset of obfuscated programs in which the malicious program is compressed and cannot be analyzed.
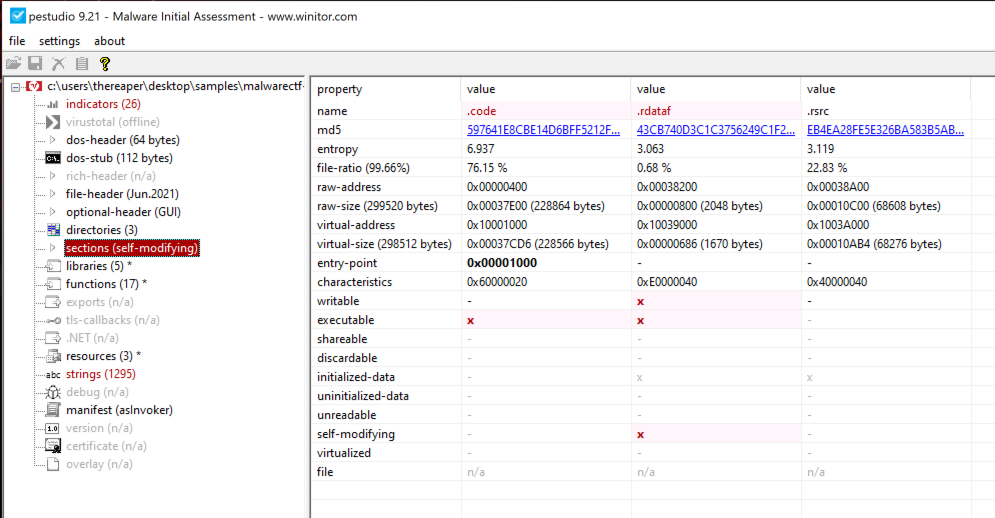
There are several indicators we can look for:
- Non-standard section names
- High entropy values
- Self-modifying sections
- Low number of strings or imports
- DetectItEasy analysis
Below is a shot of PeStudio indicating a few of these things.
Flag: Yes
Break It Into Sections
We already have this file open in PeStudio, so, let’s not overthink this one. The sections category shows which sections have the executable flag set.

Flag: code, rdataf
I’ll Take What I Can Get
The execution level will also be indicated in PeStudio under the manifest section. This info will indicate if the malware requires elevated permissions or not.
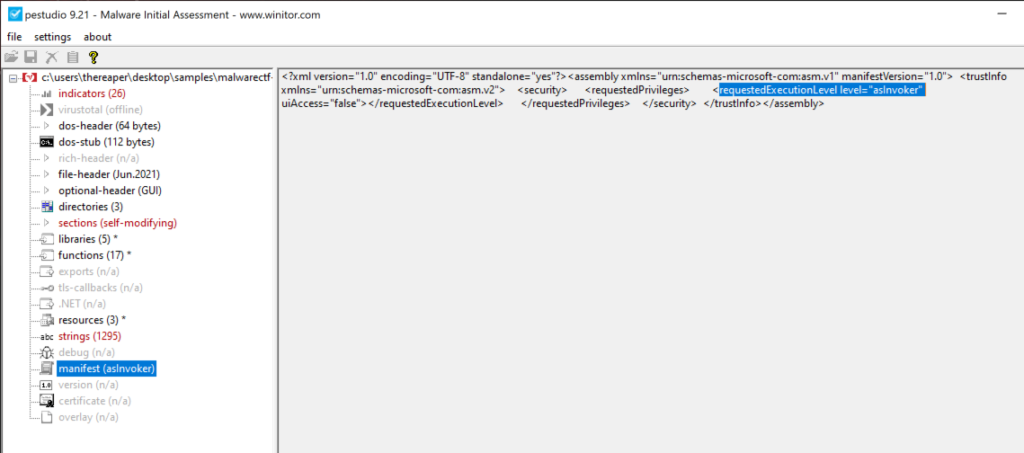
Flag: asinvoker
Persistent Lil’ Bugger
Persistence can often be overlooked when triaging a host; and TAs love being able to continue exploiting a host, even after remediation attempts. Therefore, having details about what persistence mechanisms a sample uses will make remediation a once-and-done task. Looking through VT, we will see a few different nuggets that we can use. Either under the Behavior tab or one of the sandbox detonations on the Community tab, we see that this malware appears to create a scheduled task.
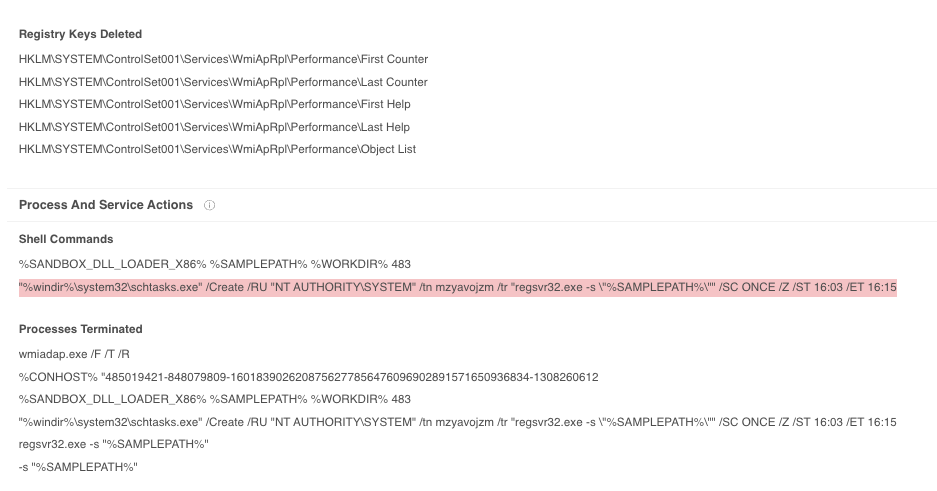
Flag: scheduled task
I’m Still Unpacking
OK. Strap in folks, this one is going to go a little deeper than we have seen so far….
After determining this sample is packed and attempting to identify the packer used appears to be a dead end, it seems we have to do this the manual way.
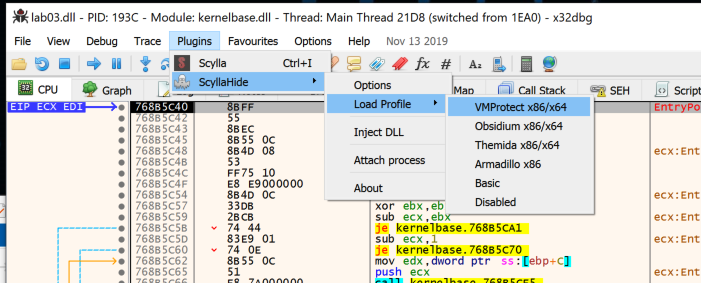
For this task, we will use x64dbg with ScyllaHide plugin installed. I’m going to just lay out a list of instructions to make this a little easier to follow.
- Rename the sample or add a DLL extension (would not debug correctly with no extension)
- Open in x32dbg (it installs along with x64dbg)
- Insure ScyllaHide profile is enabled
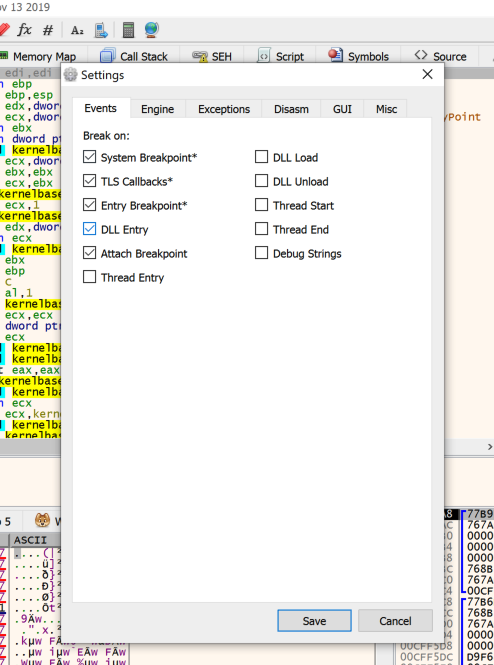
- Check that DLL Entry is checked under Options>Preferences>Events
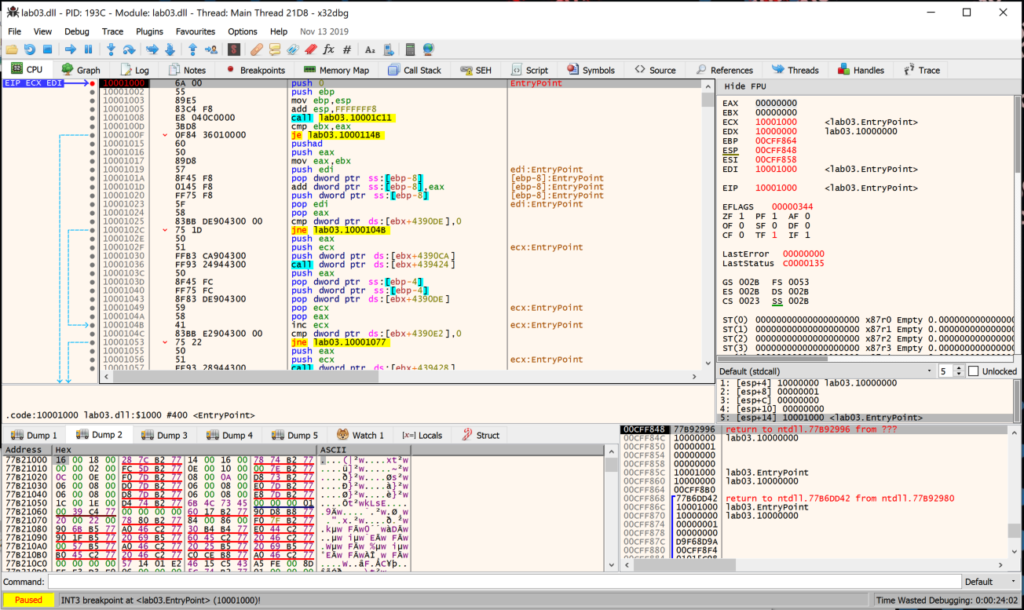
- Run DLL until the name of your DLL is the current module.
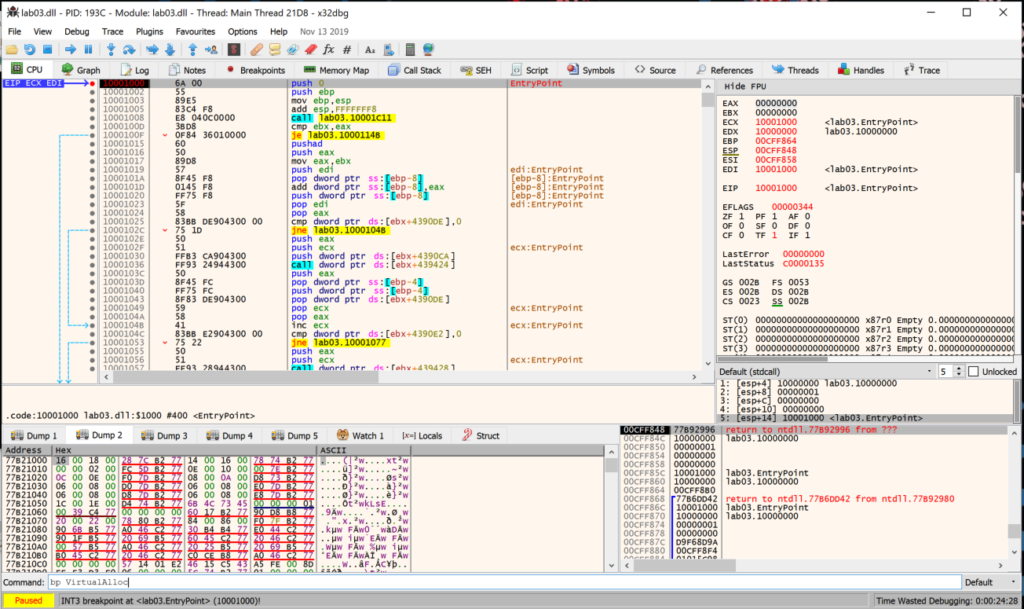
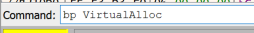
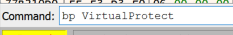
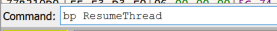
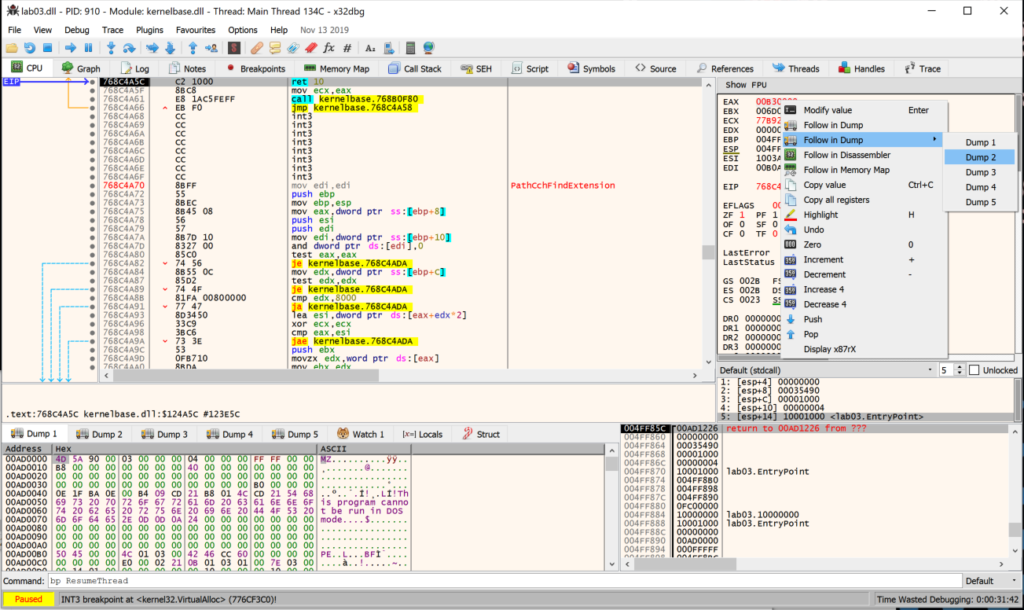
- In Command box, create breakpoint for VirtualAlloc, VirtualProtect, & ResumeThread
- Run until you hit VirtualAlloc breakpoint, then use ‘Execute till return’ function.
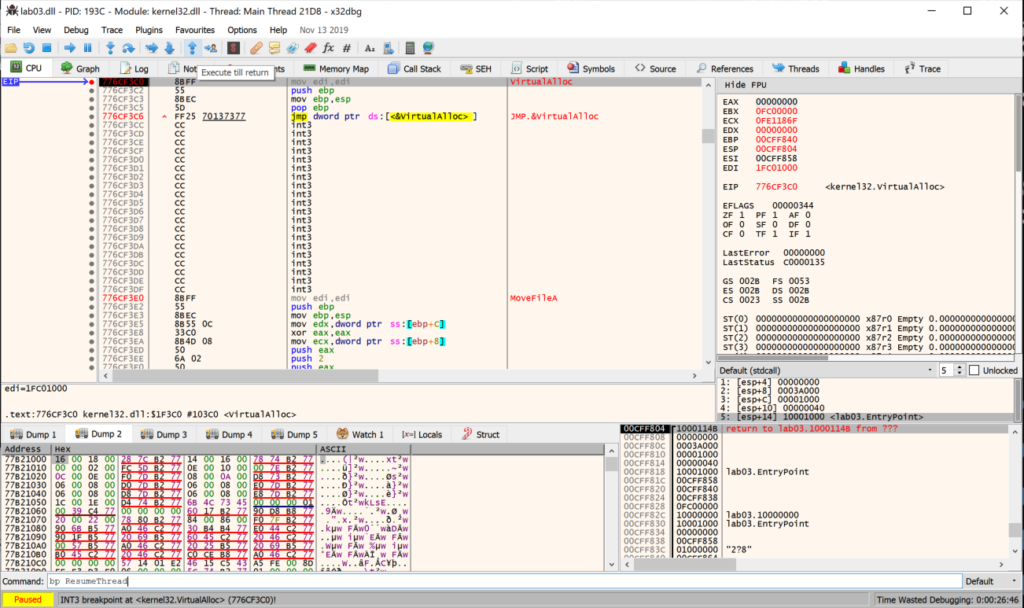
- When ‘ret’ is hit, right click EAX register and select Follow in Dump (note the memory section is empty)
- Continue running the file and it will hit another VirtualAlloc breakpoint, use ‘Execute till return’ function
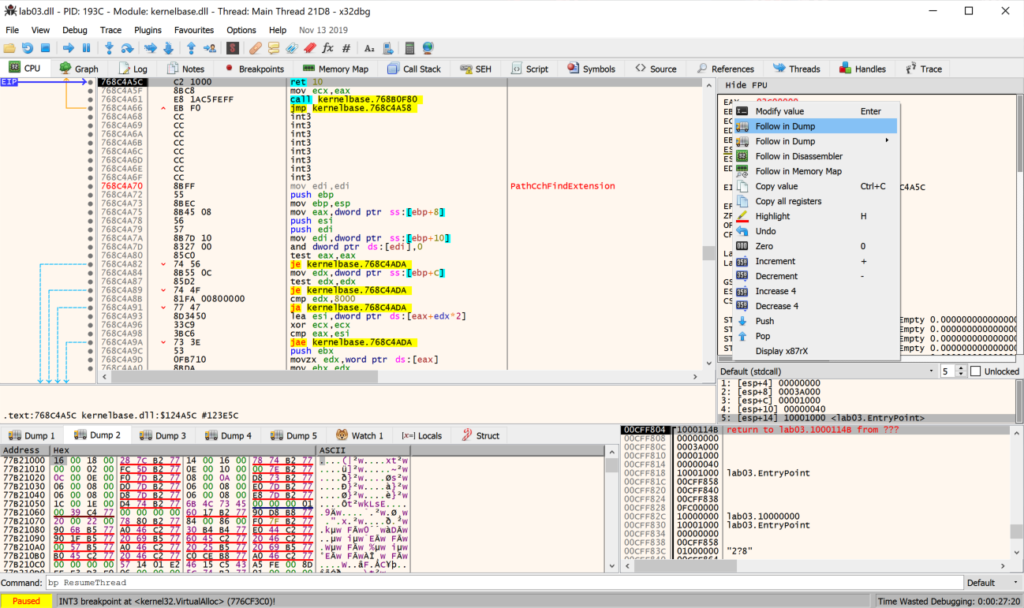
- When ‘ret’ is hit, right click EAX register and select Follow in Dump>Dump 2 (memory section is empty)
- Run the program until VirtualProtect is hit and view Dump 1. Hmmm. This appears to have an MZ header, but the code doesn’t look like a fully formed PE.
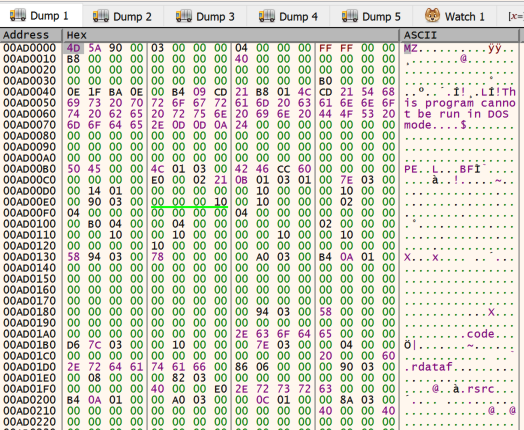
- Continue running the program until the next VirtualProtect breakpoint, notice that stdcall shows “PE”
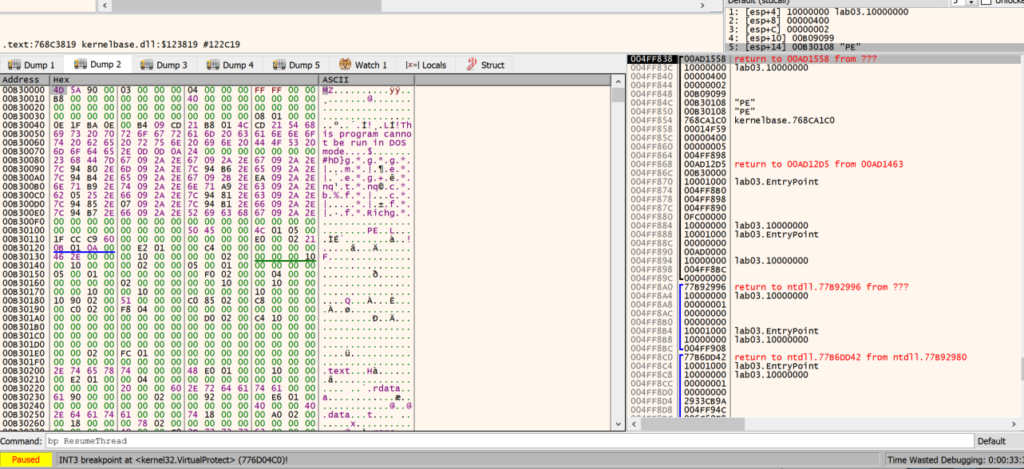
- View Dump 2. This appears to be a PE file, right click in Dump 2 and select ‘Follow in Memory Map’
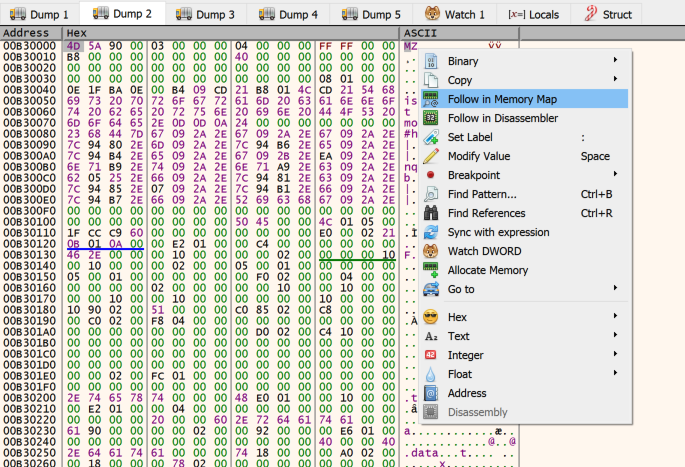
- On Memory Map tab, right click section and select ‘Dump Memory to File’.
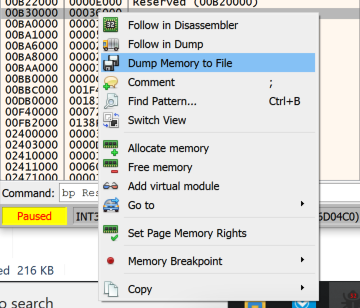
- Open the dumped file in PeStudio and copy the hash.
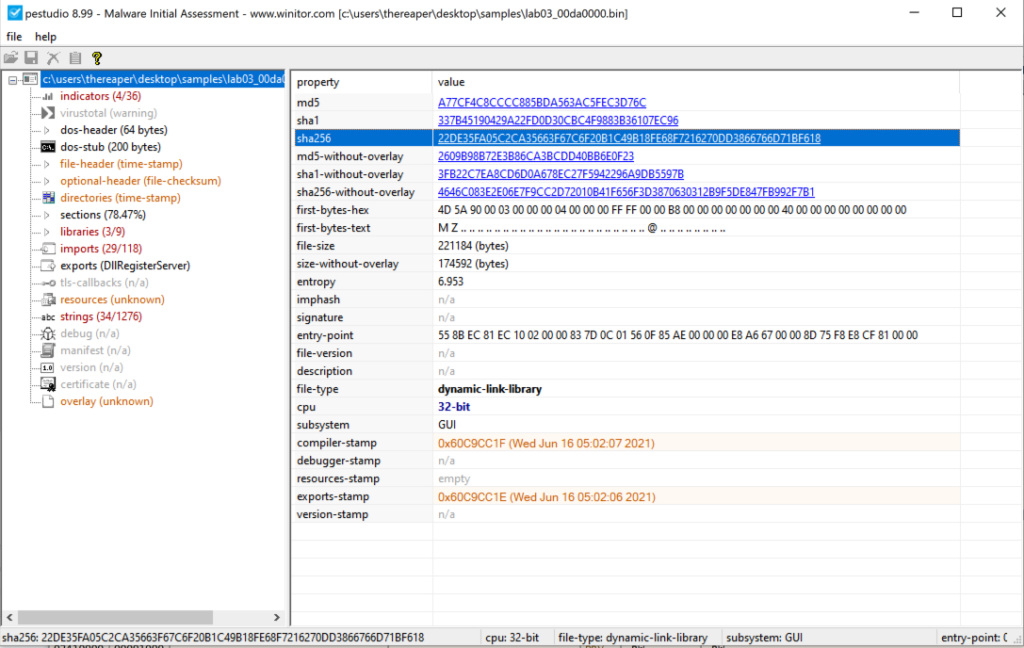
Flag: 22DE35FA05C2CA35663F67C6F20B1C49B18FE68F7216270DD3866766D71BF618